“Isolation and distancing flatten the curve, but they also challenge our educational goals.”
Bloom, D.A, et al.
Race and Achievement Levels
An examination of the relationship between Race and Achievement Levels.
How did math and reading achievement scores change across racial groups in U.S. school districts between 2019 and 2024, and to what extent did the COVID-19 pandemic widen pre-existing racial achievement gaps during both the decline (2019–2022) and recovery (2022–2024) periods?
Racial disparities are a significant component of understanding whether post-COVID academic recovery has been uniform across student populations. Long-standing racial inequalities in education, housing, healthcare access, and community resources may influence how students experience disruptions in schooling. These structural differences existed before the pandemic and may have shaped how effectively students were able to adapt to remote learning and later recover academically. By analyzing achievement trends by racial groups, we can examine whether different groups experienced similar levels of learning loss and recovery, or whether patterns varied over time.
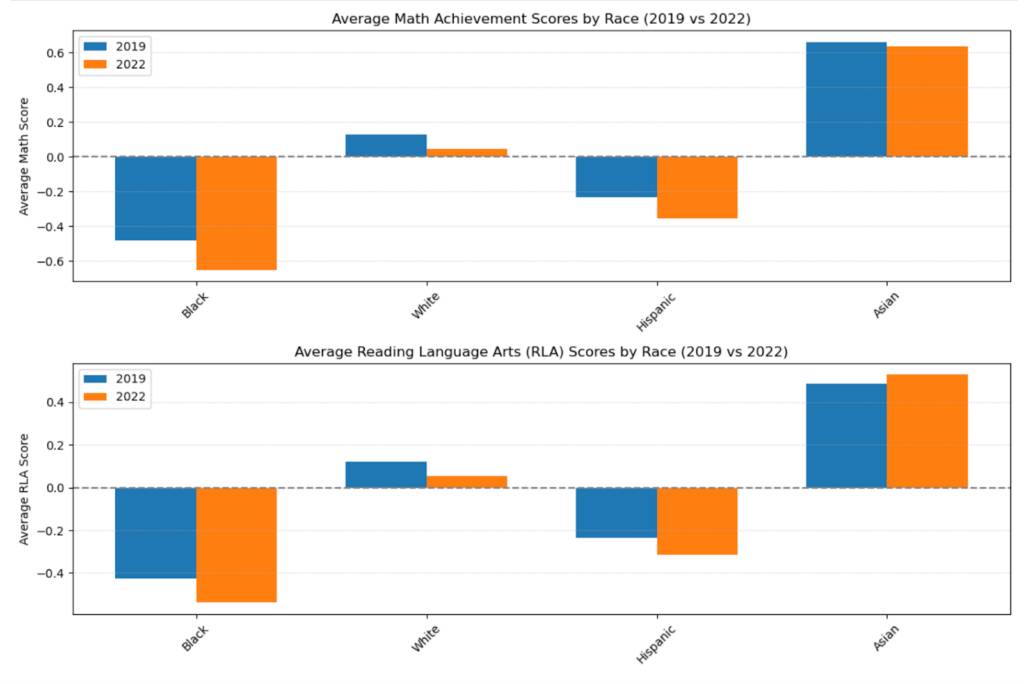
Fig 1: RLA and math scores by race from 2019 to 2022 show that Black and Hispanic students fell further below the national average, while White and Asian students remained above it, highlighting widening achievement gaps during the pandemic.
The 2019 to 2022 comparison charts show that declines in both Math and Reading Language Arts (RLA) were not identical across racial groups. Black (BLK) and Hispanic (HSP) students appear to have experienced larger drops in average scores compared to White (WHT) and Northeast Asian (NEC) students. While all groups show some decline during the pandemic period, the magnitude of change differs, suggesting that recovery trajectories may not be evenly distributed. Some groups began the pandemic with higher baseline scores and remained above the overall average even after the decline, while others experienced deeper drops relative to their pre-pandemic levels.
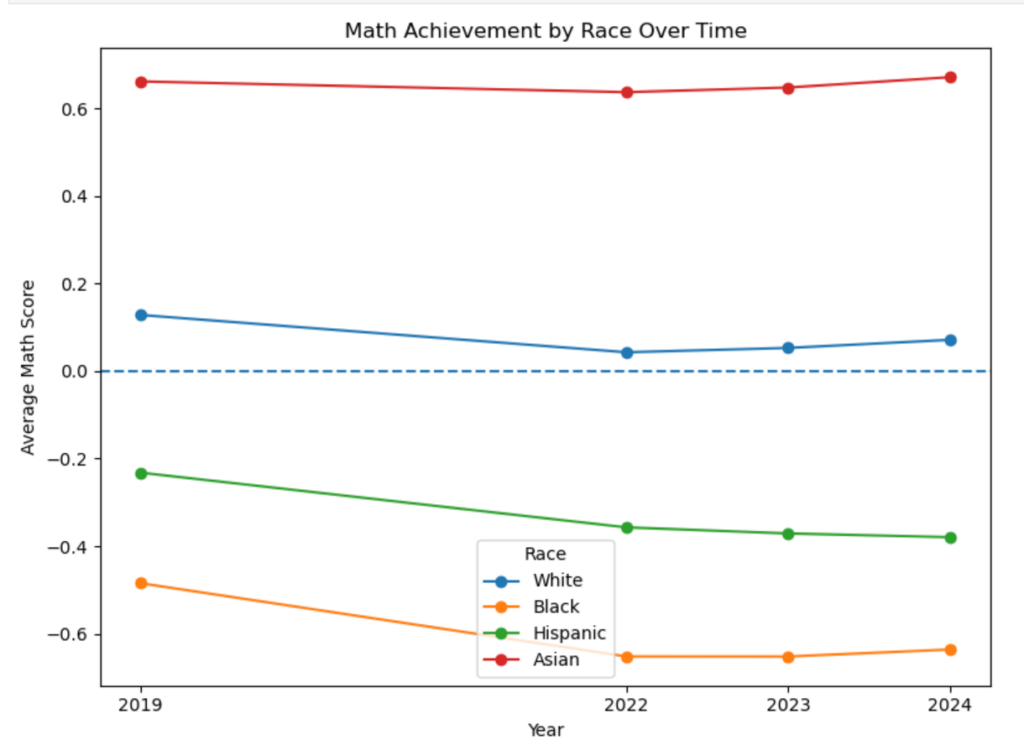
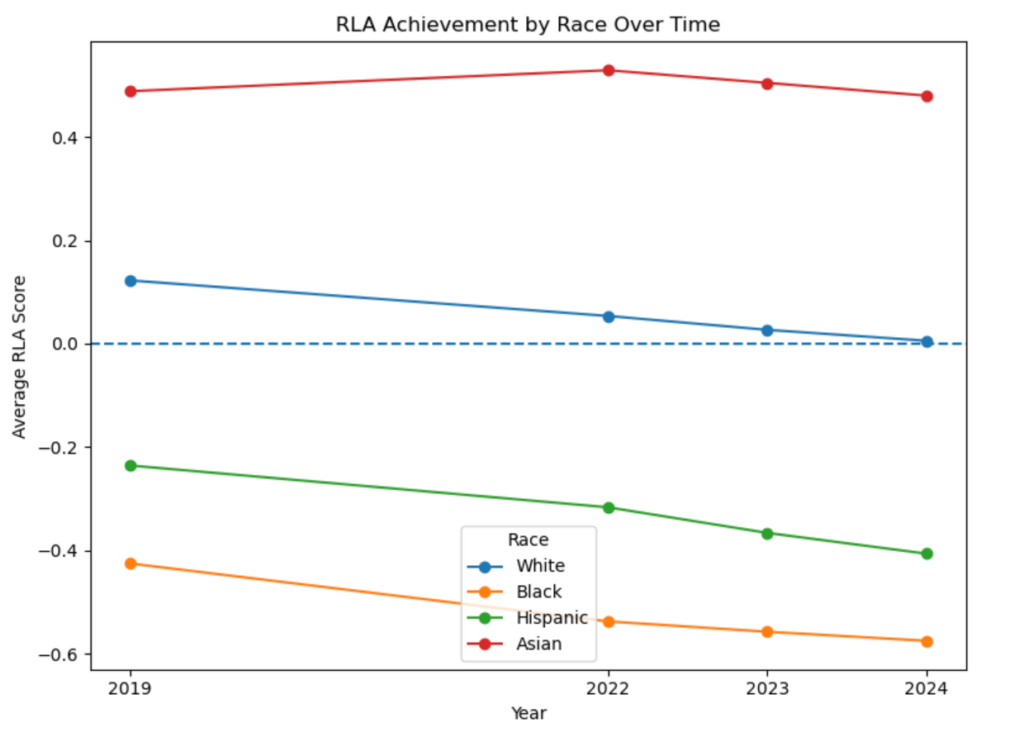
Fig. 2 & 3: Math and RLA achievement scores over time by racial subgroup, with the dashed line representing the national average. Black and Hispanic students remain below the national average and have not fully returned to their 2019 baseline, while White and Asian students stay above the national average and recover to baseline more quickly by 2024.
The longitudinal trends from 2019 to 2024 provide additional context. In Math, several groups show gradual stabilization after 2022, but not all return to their pre-pandemic levels. Similar patterns are observed in RLA, where recovery varies in scale and pace across subgroups. Some groups demonstrate partial rebounds, while others remain below their 2019 baseline.
Several structural factors may help explain why different racial groups experienced different academic trends during the pandemic. For example, research has shown that access to reliable internet, digital devices, and quiet learning environments varied significantly across communities. Students from historically marginalized racial groups were more likely to face challenges such as limited broadband access, crowded housing conditions, and reduced access to academic support outside of school. In many households, students attempted to complete assignments from shared living spaces while siblings or parents also relied on the same internet connection for work or school. These factors may have made remote learning more difficult for some students during school closures (Ye;Auxier & Anderson, 2020).
Several structural factors may help explain why different racial groups experienced different academic trends during the pandemic. For example, research has shown that access to reliable internet, digital devices, and quiet learning environments varied significantly across communities. Students from historically marginalized racial groups were more likely to face challenges such as limited broadband access, crowded housing conditions, and reduced access to academic support outside of school. These factors may have made remote learning more difficult for some students during school closures (Auxier & Anderson, 2020).
Based on these visualizations, racial patterns in learning loss and recovery are not identical across groups. While further analysis is needed to determine causation, the data suggests that post-COVID recovery has followed different trajectories across racial subgroups, raising important questions about how structural, regional, and socioeconomic factors may have influenced these outcomes.
Socioeconomic Status and Achievement Levels
An examination of the relationship between Socioeconomic status and Achievement Levels.
How did economically disadvantaged and non-economically disadvantaged students differ in their levels of learning loss and academic recovery in math and reading from 2019 to 2024, and did the pandemic deepen pre-existing socioeconomic disparities in educational outcomes across school districts?
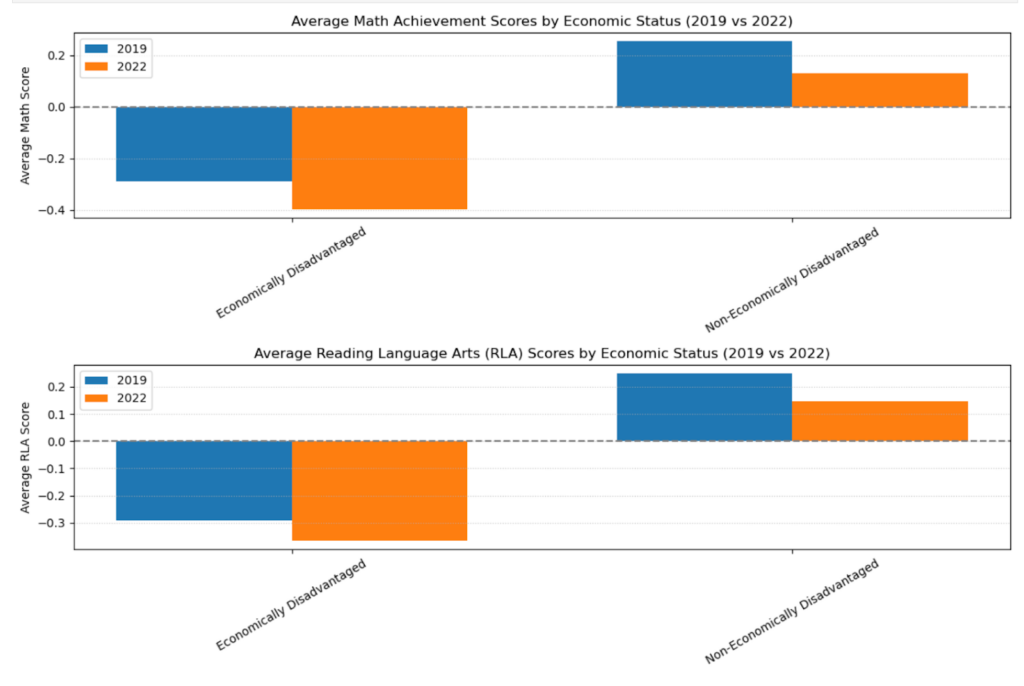
Fig. 4: This figure shows the average Math and Reading Language Arts (RLA) scores by economic status (economically disadvantaged vs non-economically disadvantaged) for the years 2019 and 2022.
Socioeconomic status has also proven to be a strong predictor of post-pandemic academic achievement. Our dataset shows that economically disadvantaged students consistently perform worse than their non-economically disadvantaged peers, both before and after the COVID-19 pandemic. In 2019, economically disadvantaged students scored below average in both math and reading language arts while non-economically disadvantaged students performed above average. Following the pandemic, achievement declined for both groups, but disadvantaged students experienced larger losses and fell even further below average. In contrast, non-economically disadvantaged students remained above average. These findings align with a substantial body of research showing that students of low socioeconomic backgrounds are disproportionately affected by pandemic school closures (Betthäuser et al.; Hammerstein et al.; Jakubowski et al.; Kuhfeld et al.; Kurmann and Lalé; Molnár and Herman; van de Werfhorst).
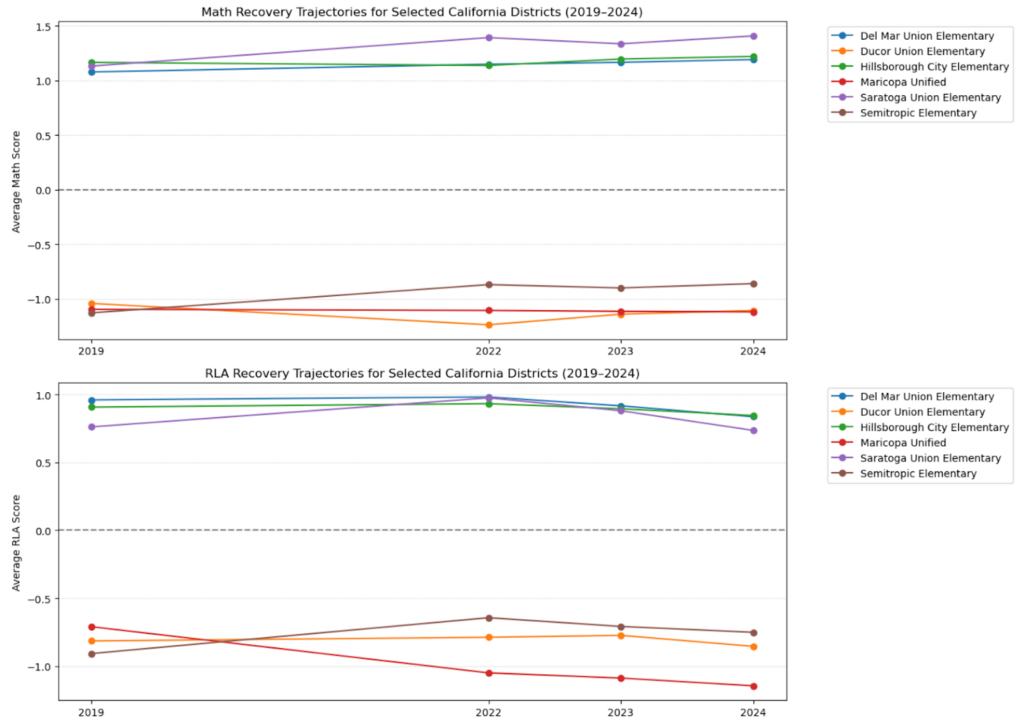
Fig. 5: Comparison of average math achievement scores across schools before and after the pandemic, showing that while some low-income, disadvantaged districts (e.g., Maricopa Unified, Semitropic, Ducor Union) made gains after COVID-19, their scores remain lower overall compared with high-income, affluent districts (e.g., Saratoga Union, Del Mar Union, Hillsborough City), highlighting the persistent achievement gap.
We observe significant achievement gaps depending on socioeconomic status when looking at both individual- and school-level poverty. We can see the school-level impact when examining SEDA’s data on various school districts. For example, Maricopa Unified School District in Kern County, California serves a largely disadvantaged population. Approximately 98.7% of students in the district are considered economically disadvantaged and the mean income in the area was just over $25,000 in 2024 (“Census Profile: Maricopa Unified School District”). In contrast, Saratoga Union Elementary School District in Santa Clara County, California serves a vastly different population. It is located in an affluent, high-income neighborhood, with the median household income of $250,000, and hence benefits from high property taxes (“Census Profile: Saratoga Union Elementary School District”). When comparing academic achievement across these districts (and some other California districts similarly categorized as high or low income), we notice significant disparities. Saratoga Union and other affluent districts report high scores (well above average) before and after the pandemic. Maricopa and other more impoverished districts, on the other hand, report scores consistently below average.
These differences in performance also reflect the unequal learning environments students experienced during the pandemic. As a case study, district-level comparisons between Saratoga Union Elementary School District and Maricopa Unified School District illustrate how socioeconomic inequality shaped access to educational resources. Students in affluent districts such as Saratoga Union were more likely to have access to personal devices and stable internet connections, allowing schools to transition more smoothly to remote learning (Ye). In contrast, districts serving lower-income communities, such as Maricopa Unified in Kern County, often faced technology gaps; many students initially lacked reliable internet or computers for online instruction (Meszaros). These disparities highlight how unequal access to digital resources shaped students’ ability to participate in remote learning during the pandemic. National research similarly found that students from low-income households were significantly less likely to have reliable computers or broadband access (National Education Association; Rideout and Robb).
Interestingly, both wealthy and poorer districts appear to follow similar recovery trajectories. While their achievement levels differ substantially, many districts’ 2024 scores return to levels comparable with their respective 2019 baselines.
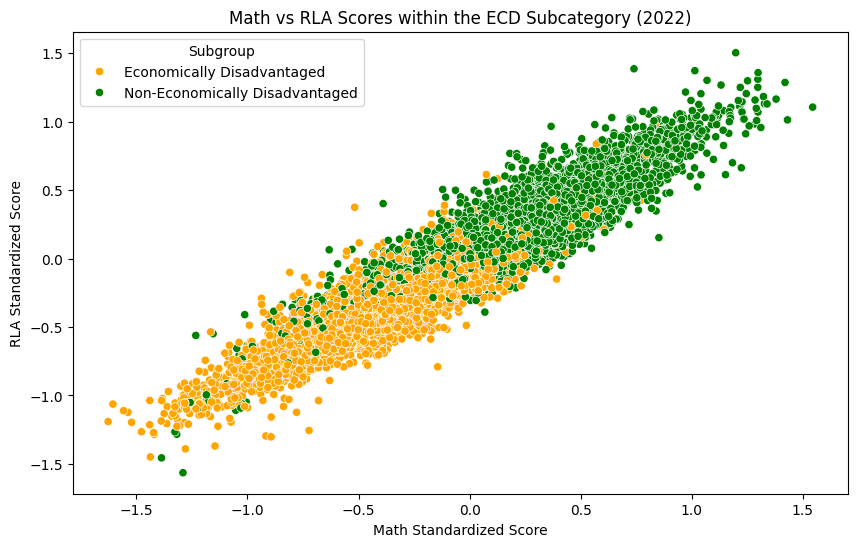
Fig. 6: This scatterplot depicts each district in the ECD subcategory from the SEDA dataset’s standardized Math and RLA scores in the year 2022. All districts with a standard deviation of more than .05 were removed. ECD (Economically Disadvantaged) districts were plotted in yellow, and NEC(Non-Economically Disadvantaged) districts were plotted in green.
The correlation between socioeconomic status and test scores can be attributed to unequal access to resources, differences in learning environments, and various levels of support from families and schools. One contributing factor is health care access. Students from low-income families are more likely to experience limited health coverage and higher exposure to illness, which during the pandemic could lead to increased stress, absences due to illness, or other learning disruptions. Another important factor is access to technology and internet connectivity. When schools shifted to remote learning, students without reliable devices or WiFi often struggled to attend virtual classes or access online materials. School-level resources also influenced learning outcomes. Schools in higher-poverty communities often had fewer financial and technological resources to effectively support remote instruction. Finally, family financial resources shaped the extent to which students could compensate for pandemic-related learning disruptions. High-income families can afford to pay for private tutors or additional educational programs to supplement public schools’ shortcomings and mitigate learning loss (Kuhfeld et al. 502-503). Together, these disparities in resources and support likely contributed to the larger learning losses observed among economically disadvantaged students during the pandemic.
Region and Achievement Level
An examination of the relationship between Region and Achievement Levels.
How did patterns of learning loss and academic recovery from 2019 to 2024 vary across U.S. regions, particularly between Southern and Northeastern states, and what do these regional differences reveal about the relationship between geography, policy responses, and educational inequality during the COVID-19 pandemic?
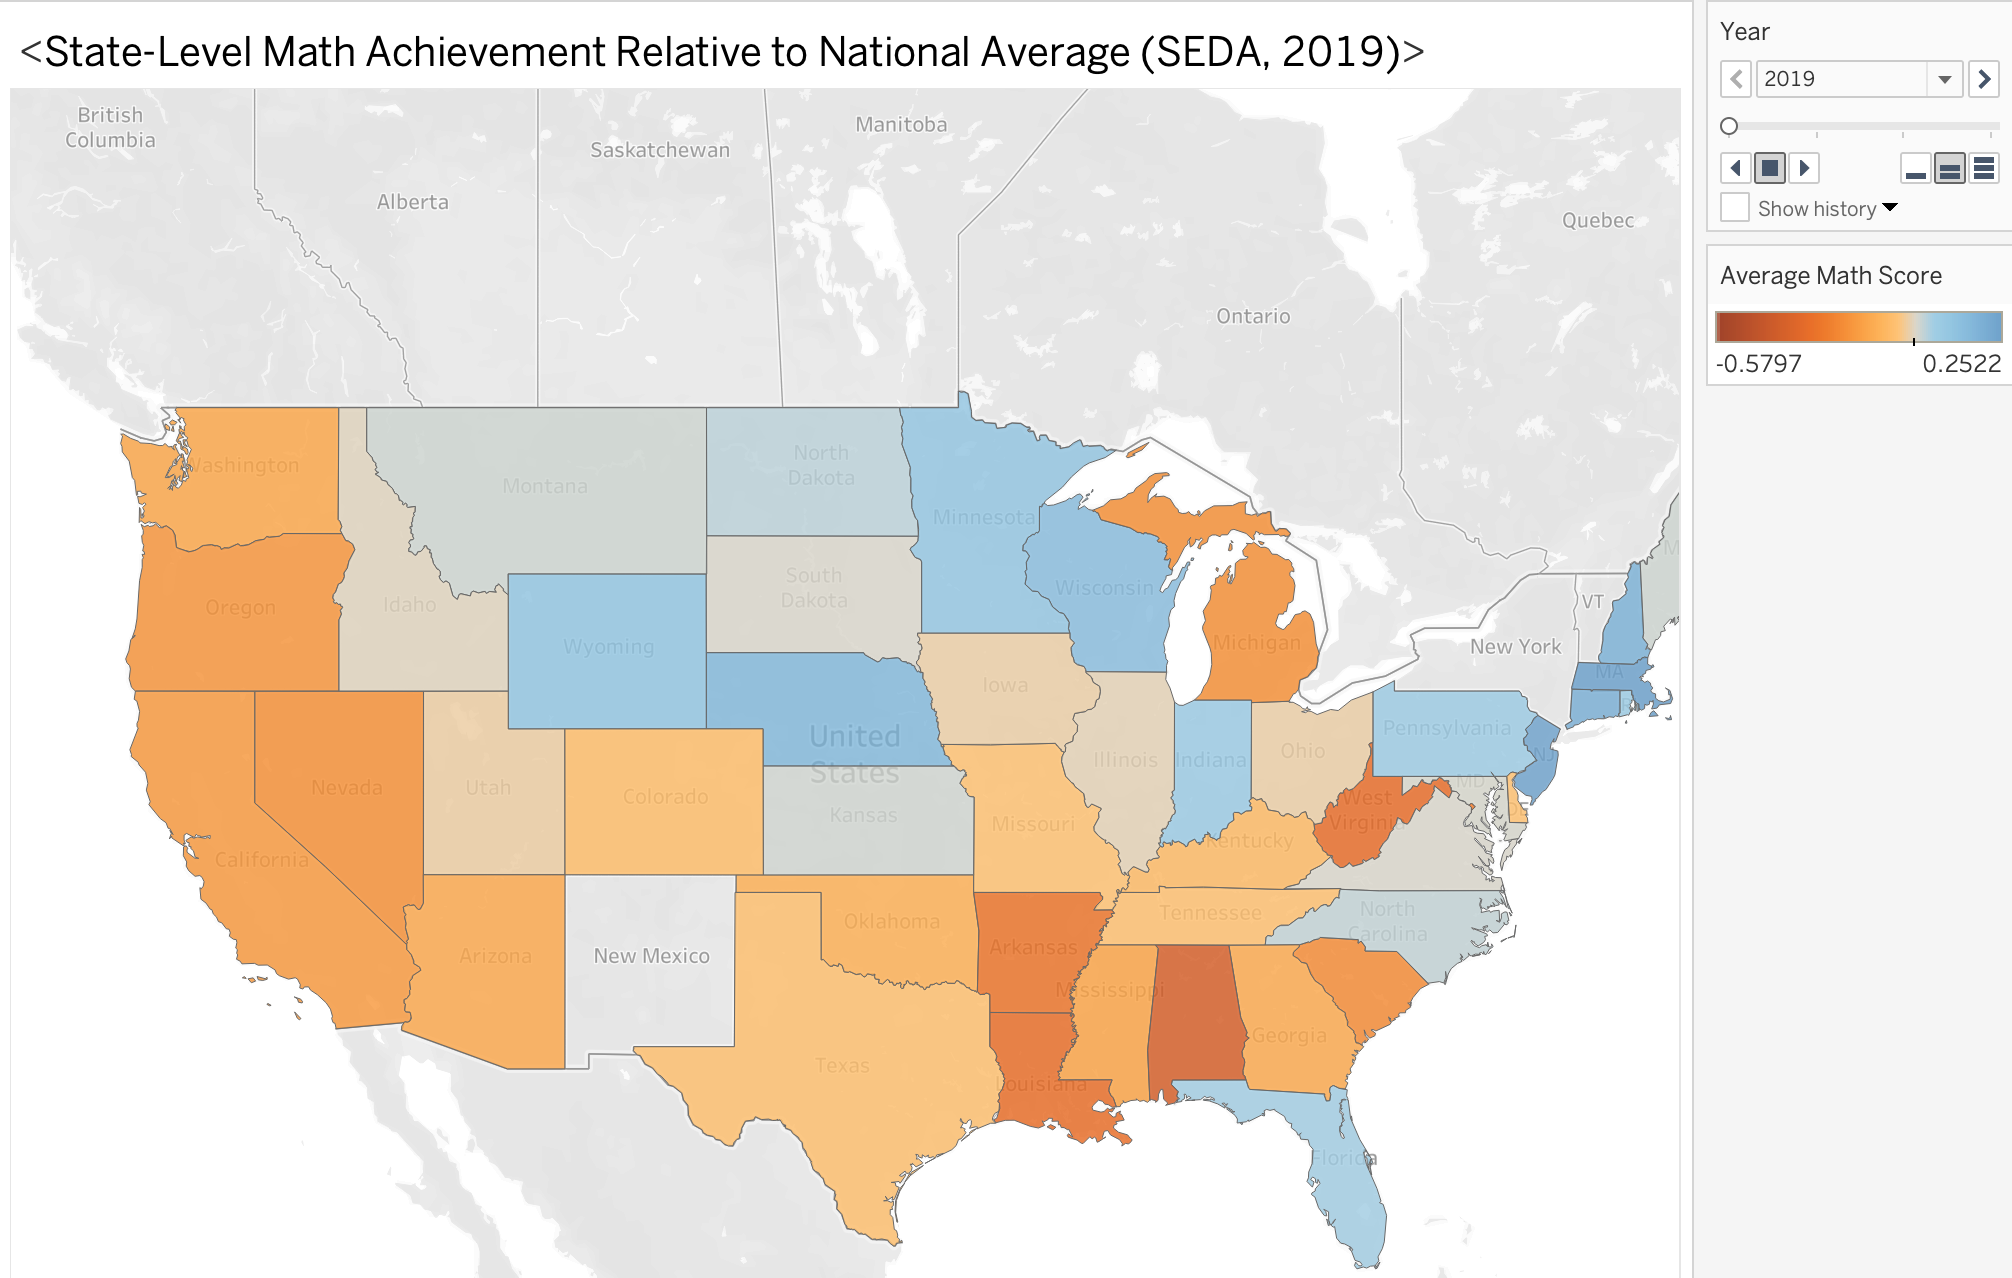
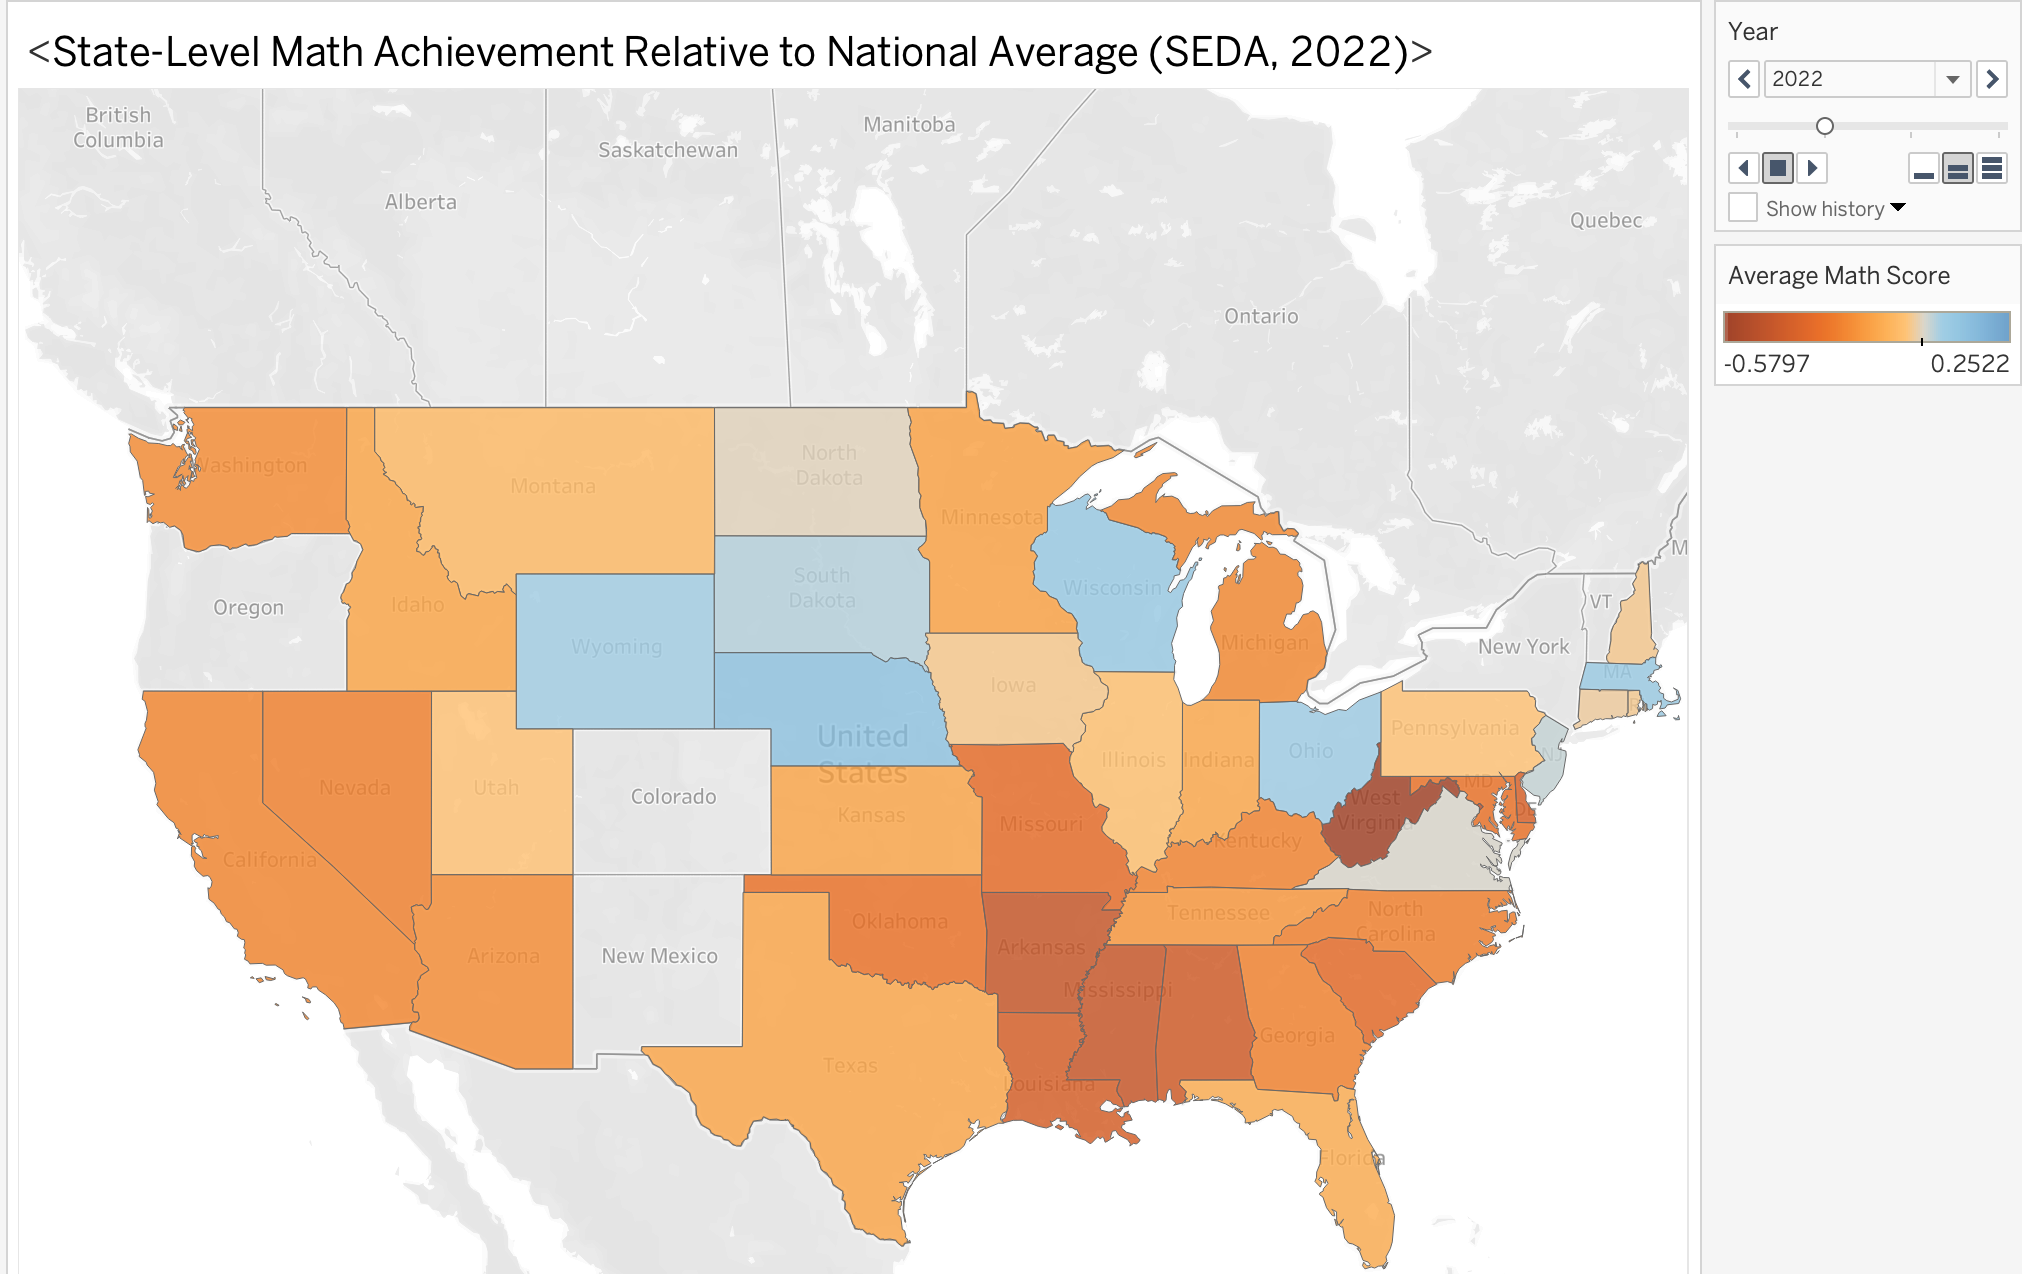
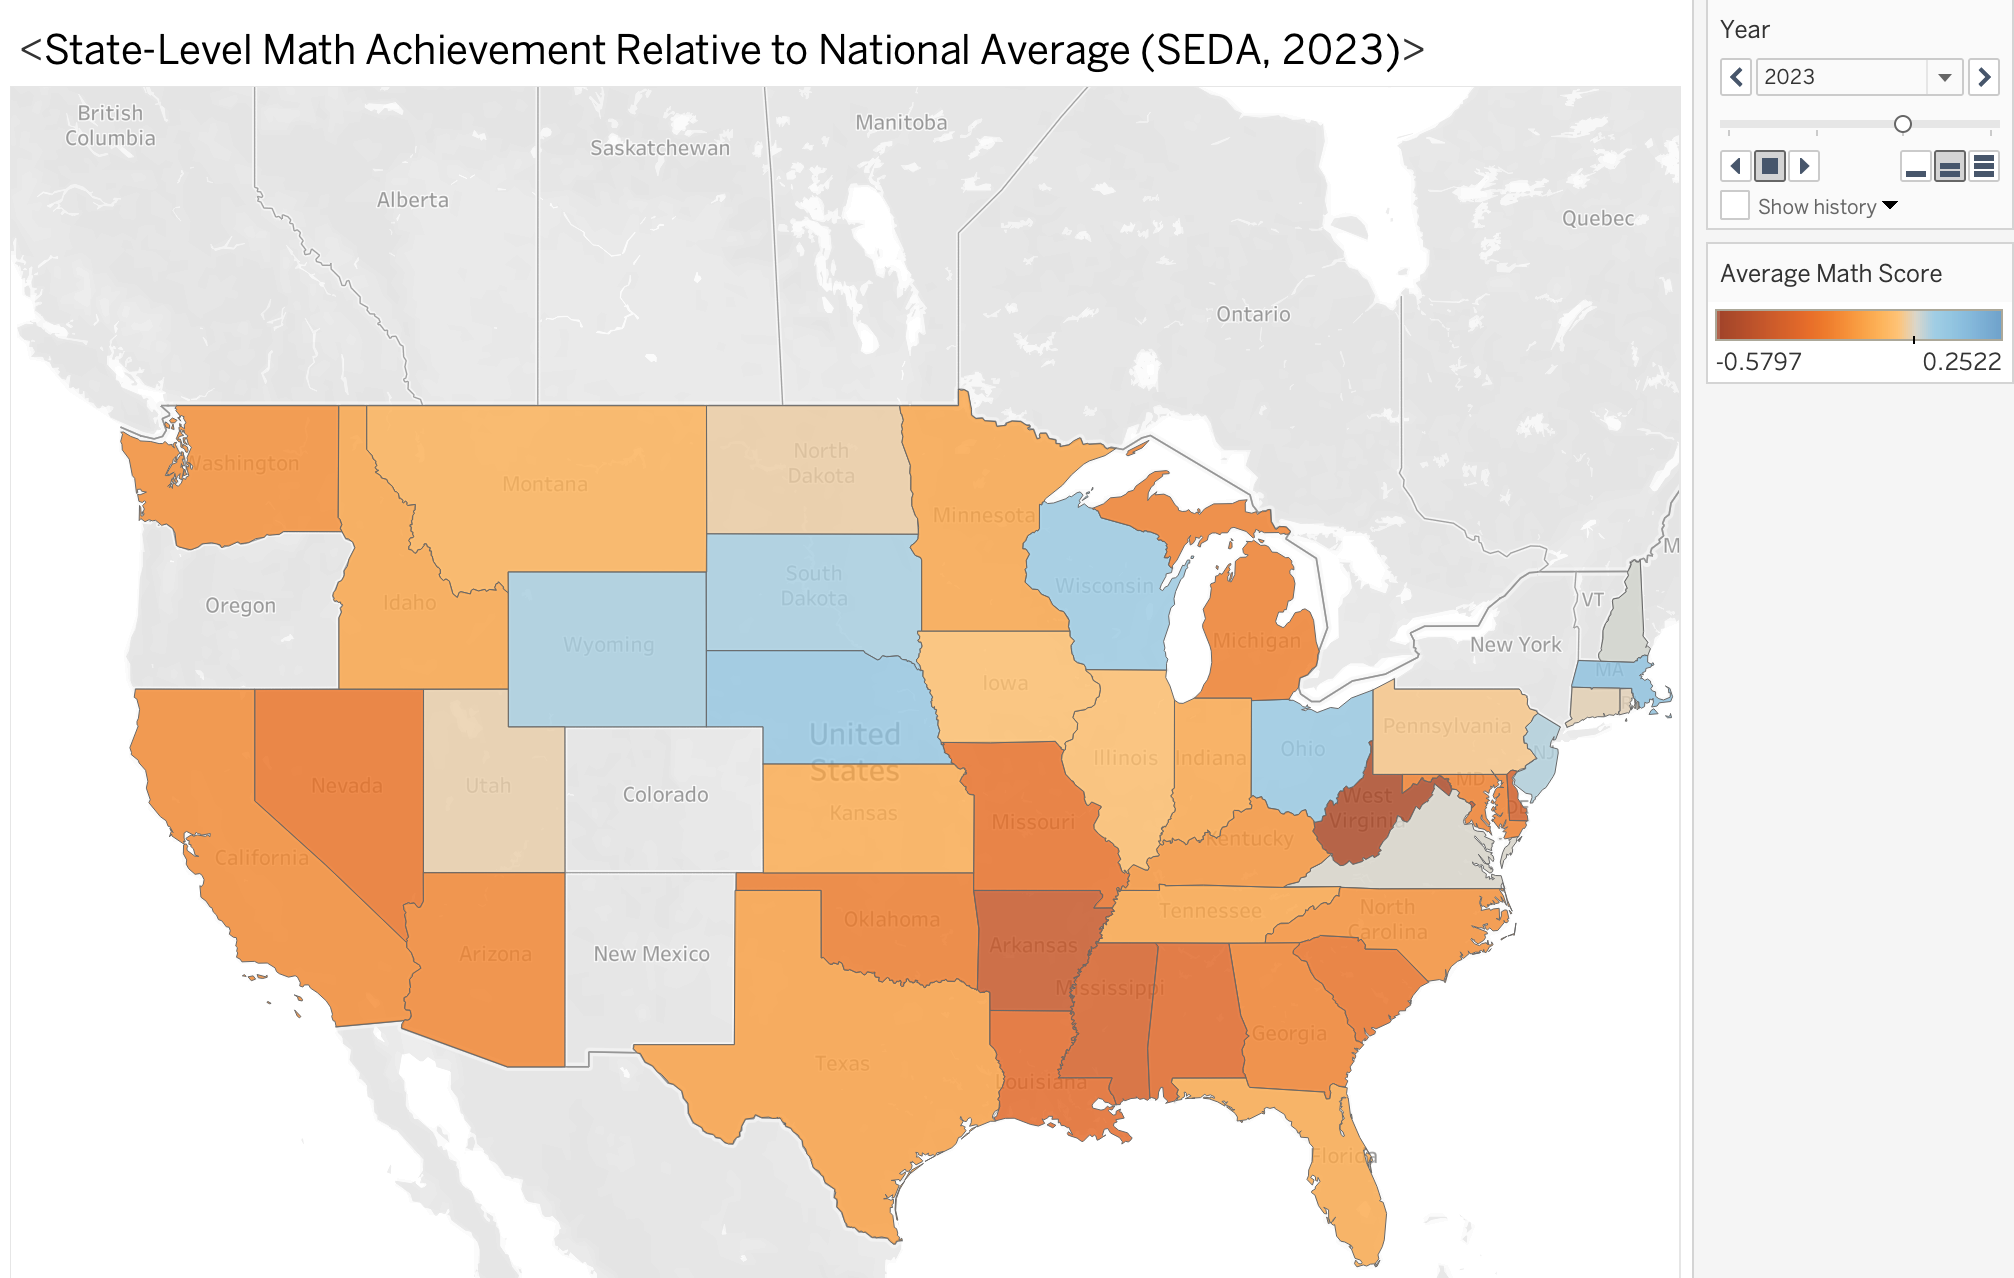
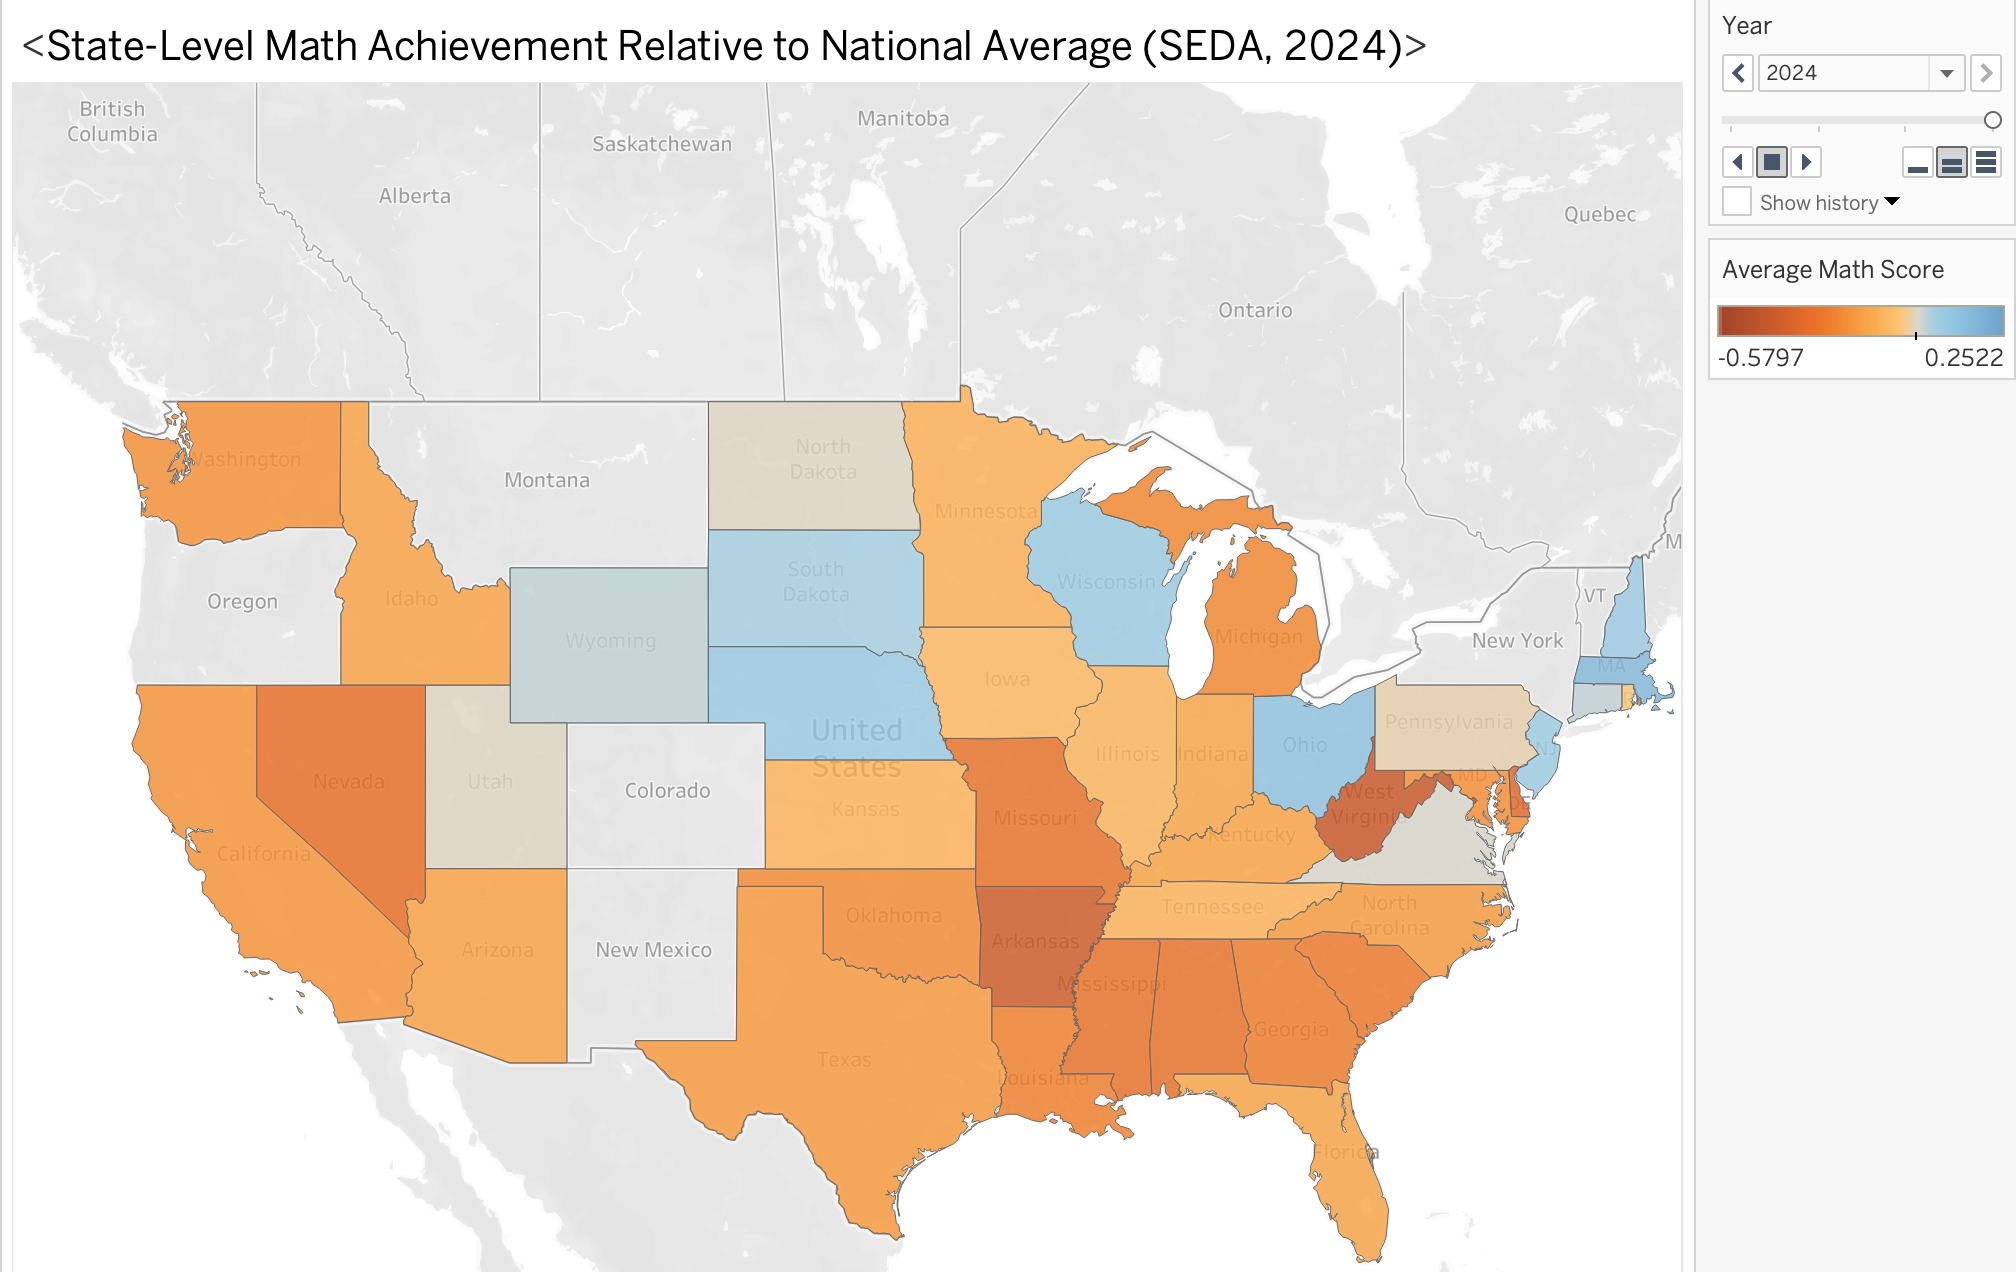
Fig. 7: This choropleth map shows state-level math achievement (2019–2024) from SEDA, with blue indicating above-average scores and red-orange below-average relative to the national mean. A year slider highlights how COVID-19 impacted achievement: Northern states recovered faster by 2023–2024, while many Southern states remained below average, reflecting regional disparities in educational resources and pandemic recovery.
Geography played a major role in shaping how communities experienced educational disruption and recovery during the COVID-19 pandemic. Figure 7 visualizes these patterns using a choropleth map of state-level math achievement from 2019 to 2024. Some states consistently performed above the national average, while others remained below, highlighting regional disparities that became more visible during the pandemic. Differences between the Northeast and the South—which often align with political divisions between Democratic-leaning and Republican-leaning states—shaped school responses, remote learning policies, and the allocation of federal relief funding, contributing to variation in educational outcomes documented in the Stanford Education Data Archive (SEDA).
In the early stages of the pandemic, many Northeastern states implemented stricter public health measures and kept schools closed longer, relying heavily on remote instruction during the 2020–2021 academic year. Longer closures were strongly associated with declines in student achievement, suggesting that extended remote learning contributed to learning loss (Patrinos). In contrast, many Southern states reopened schools earlier, sending students back into classrooms that were often under-resourced, with outdated textbooks, broken equipment, or little tutoring support. Meanwhile, students in the Northeast could continue learning from home, often using reliable laptops, fast internet, and virtual support from teachers (Patrinos). These differences in classroom resources and technology access show how reopening timelines intersected with structural inequalities, shaping not just test scores but daily learning experiences. Southern states historically face higher poverty rates and lower per-pupil spending, while many Northeastern districts benefited from stronger infrastructure, broadband access, digital devices, and federal tutoring programs.
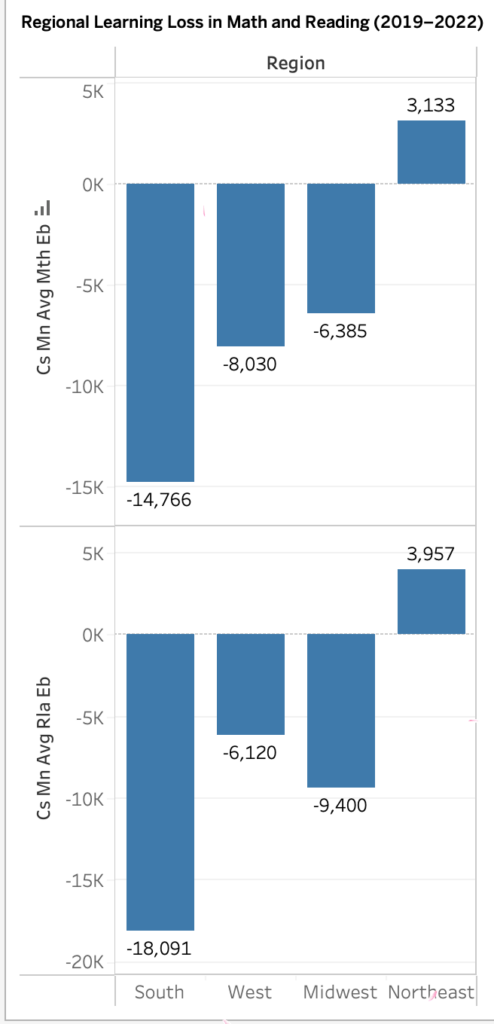
Fig. 8: Average math and reading achievement changes by U.S. region (2019–2022) show that the South experienced the largest declines, the Midwest and West had moderate losses, and the Northeast showed stability or slight recovery, highlighting regional disparities in pandemic learning loss.
National assessment data illustrate the scale of learning disruption across the U.S. Figure 8 shows that the South experienced the largest declines in math and reading between 2019 and 2022, the Midwest and West experienced moderate decreases, and the Northeast remained relatively stable. These patterns align with findings from the National Assessment of Educational Progress, which reported that average scores for nine-year-olds dropped five points in reading and seven points in mathematics between 2020 and 2022 (National Center for Education Statistics). Researchers attribute these variations to school closures, socioeconomic inequality, and differences in district resources (Jakubowski et al.).
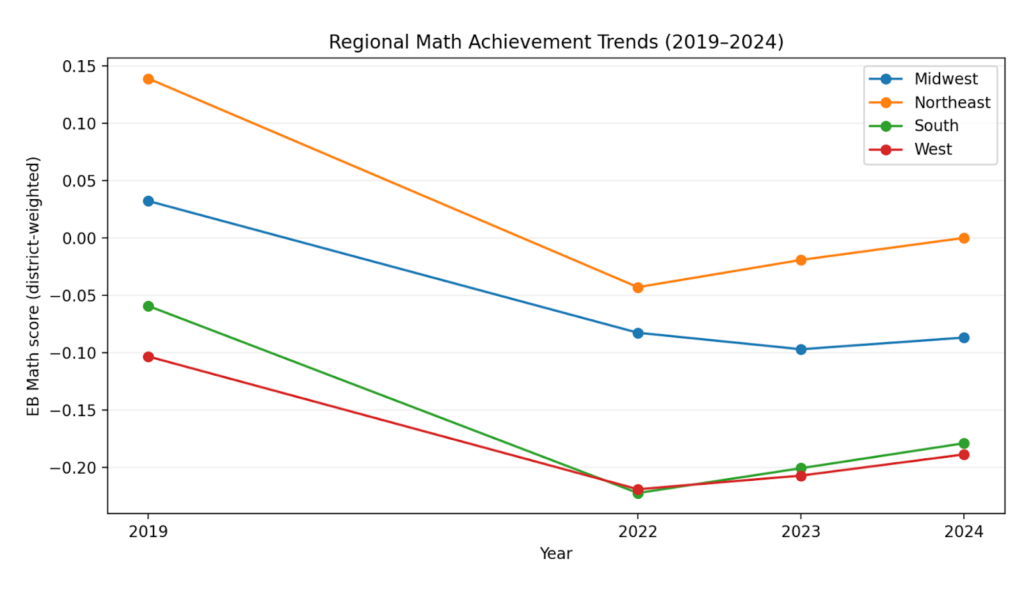
Fig. 9: This chart highlights whether some regions bounced back faster or slower after COVID disruptions. Diverging lines indicate that regional recovery is uneven, which can be linked to differences in policy responses, funding, or local histories of educational inequality. This helps us connect quantitative trends to regional contexts and policy narratives.
The Stanford Education Data Archive provides standardized measures across districts, allowing researchers to identify geographic patterns in performance and recovery. Figure 9 shows regional trends in math and reading scores from 2019 to 2024. While all regions declined after the pandemic began, recovery rates diverged over time. Some Northeastern districts saw larger initial losses due to prolonged closures, while many Southern districts faced structural inequalities and limited resources. These trends show that geography reflects not just location but also deeper political, economic, and institutional differences influencing educational outcomes.
Overall, the North–South divide highlights how political context and long-standing structural inequalities shape education. The COVID-19 pandemic did not affect all districts equally, and regional differences in policy, funding, and socioeconomic conditions contributed to uneven patterns of learning loss and recovery.
Conclusion
Key takeaways about the intersecting impacts of Race, Socioeconomic Status, and Region on Achievement Levels
The COVID-19 pandemic caused widespread learning loss in math and reading across the United States, but our analysis shows that its effects were not equal. Students from historically marginalized racial groups and economically disadvantaged households experienced larger declines and slower recovery compared with their more advantaged peers. These disparities were further influenced by geographic and political differences, with districts in the South and other under-resourced regions facing slower academic recovery despite earlier returns to in-person instruction. Structural inequalities, including access to technology, school funding, and community resources, contributed to the uneven trajectories observed across racial, socioeconomic, and regional groups. Although some students and districts almost returned to their 2019 baseline achievement levels by 2024, the pandemic mainly exacerbated existing inequalities rather than creating entirely new ones. These results underscore the need for targeted support and equitable resource allocation to help students recover from learning loss and address persistent educational disparities.